2022 Operating Statistics
This page contains historical information for the year shown only and is not intended to reflect current TTC information.
2. Conventional System
| Passenger Trips | 2022 | 2021 | Increase/ (Decrease) |
|---|---|---|---|
| Total | 318,573,000 | 197,842,000 | Increase of 120,731,000 |
Note: Total excludes Wheel-Trans
| Type | 2022 | 2021 | Increase/ (Decrease) |
|---|---|---|---|
| Bus Routes | 162 | 156 | Increase of 6 |
| Streetcar Routes | 9 | 9 | 0 |
| Subway Lines | 3 | 3 | 0 |
| ICTS (Scarborough RT Line) | 1 | 1 | 0 |
| Total | 175 | 169 | Increase of 6 |
Note: Column totals for 2022 exclude Community Bus (6 routes), Overnight Bus services (27 routes), Overnight Streetcar services (4 routes) and seasonal service (2 routes), 1 suspended streetcar route, 1 suspended Express bus route, and suspended Downtown Express bus routes (5 routes).
| Type | 2022 | 2021 | Increase/ (Decrease) |
|---|---|---|---|
| Bus Routes | 6,215.1 | 6,486.9 | (Decrease of 271.8) |
| Streetcar Routes | 354.6 | 350.6 | Increase of 4.0 |
Note: The kilometres valued in this table include round trip length of routes and their branches along shared roadways.
| Line | 2022 | 2021 | Increase/ (Decrease) |
|---|---|---|---|
| 1 Yonge-University | 38.4 | 38.4 | 0 |
| 2 Bloor-Danforth | 26.2 | 26.2 | 0 |
| 4 Sheppard | 5.5 | 5.5 | 0 |
| 3 Scarborough RT | 6.4 | 6.4 | 0 |
Note: Subway/Scarborough RT lengths are given in one-way kilometres.
SRT is an Intermediate Capacity Transit System (ICTS).
| Mode | Passengers |
|---|---|
| Buses | 161,103,454 |
| Subway Trains | 129,041,575 |
| Streetcars | 26,155,471 |
| Scarborough RT Trains | 2,452,497 |
| Total | 318,752,997 |
Passenger Vehicle Fleet*
Note: These tables provide values for in-service vehicles only.
| Type | 2022 | 2021 | Increase/ (Decrease) |
|---|---|---|---|
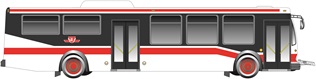
| Accessible 12-metre (40-foot) | 1,849 | 1,859 | (Decrease of 10) |
| Accessible eBus 12-metre (40-foot) | 60 | 60 | 0 |
| Accessible 18.3-metre (60-foot) | 152 | 152 | 0 |
| Total | 2,061 | 2,071 | (Decrease of 10) |
| Type | 2022 | 2021 | Increase/ (Decrease) |
|---|---|---|---|
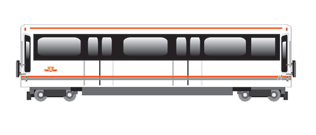
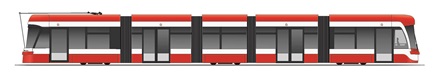
| New Low-Floor Articulated (LFLRV) | 204 | 204 | 0 |
| Total | 204 | 204 | 0 |
| Type | 2022 | 2021 | Increase/ (Decrease) |
|---|---|---|---|
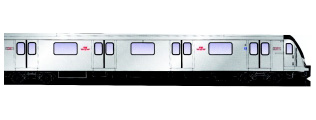
| Subway Cars | 848 | 848 | 0 |
| Scarborough RT Cars | 28 | 28 | 0 |
| Total | 876 | 876 | 0 |
Note: All Subway/RT trains are accessible. 366 T-1 subway cars are equipped with 1 multi-purpose area; 480 Toronto Rocket subway cars are equipped with 2 multi-purpose areas.
| Vehicle | 2022 | 20201 | Increase/ (Decrease) |
|---|---|---|---|
| Bus | 135,243 | 136,551 | (Decrease of 1,308) |
| Subway | 82,423 | 75,925 | Increase of 6,498) |
| Streetcar | 9,210 | 8,918 | Increase of 292 |
| Scarborough RT (ICTS*) | 3,515 | 3,608 | (Decrease of 93) |
| Total | 230,391 | 225,002 | Increase of 5,389 |
* Includes in-service vehicles only.
** All Subway/RT trains are accessible. 366 T-1 subway cars are equipped with 1 multi-purpose area; 480 Toronto Rocket subway cars are equipped with 2 multi-purpose areas.
*** Includes inside Toronto regular revenue services only.
* Intermediate Capacity Transit System.
Carrying Capacity (planned number of customers per vehicle)
TTC SRT Car: 30 seated; 55 maximum (220 for a 4-car train)
TTC Bus: 36 seated; 51 maximum
TTC LFLRV: 70 seated; 130 maximum
TTC T1 Subway Car: 66 seated; 167 maximum (1,000 for a 6-car train)
TTC Toronto Rocket Car: 64-68 seated; 180 maximum (1,080 for a 6-car train)